\(
Cafeteria food waste at the University of the Pacific (UOP) in Stockton, CA is a problem. But this problem is hardly unique to their institution or any other university. According to the latest published US EPA estimates, food waste totaled over 66 million tons nationally in 2019 across all food retail, food service, and residential sectors. To help raise awareness of this problem, a group of UOP Mechanical Engineering students decided to devote their senior project to it. Armed with inspiration and a few load measurement devices from Tacuna Systems, they created an innovative food waste measuring device hoping to increase their fellow students’ social responsibility.
Project Technical Profile
- Client / Partner: University of the Pacific (UOP) Senior Engineering Team & MESA (California’s Mathematics, Engineering and Science Achievement program) Initiative
- Application Category: IoT Food Waste Measurement & Automated Logistics Tracking
- The Social Challenge: Measuring food waste to highlight the national issue of over 66 million tons generated annually.
- The Operational Challenge: Designing an automated system to weigh incoming cafeteria tray waste on a moving, vertical conveyor layout without disrupting student drop-off behaviors.
- The Mechanical Challenge: Compensating for non-axial forces and an angular displacement of 3.87° introduced by custom wheel ramps that guide the tray structure onto the load sensors.
- Hardware Enabler: Two 50 kg ANYLOAD 108BA Aluminum Single Point load cells summed via an ANYLOAD J04EA-16/J04SA-16 J-BOXER junction box running into a Raspberry Pi 4 image recognition matrix.
The MESA Initiative and the Food Waste Measurement Concept
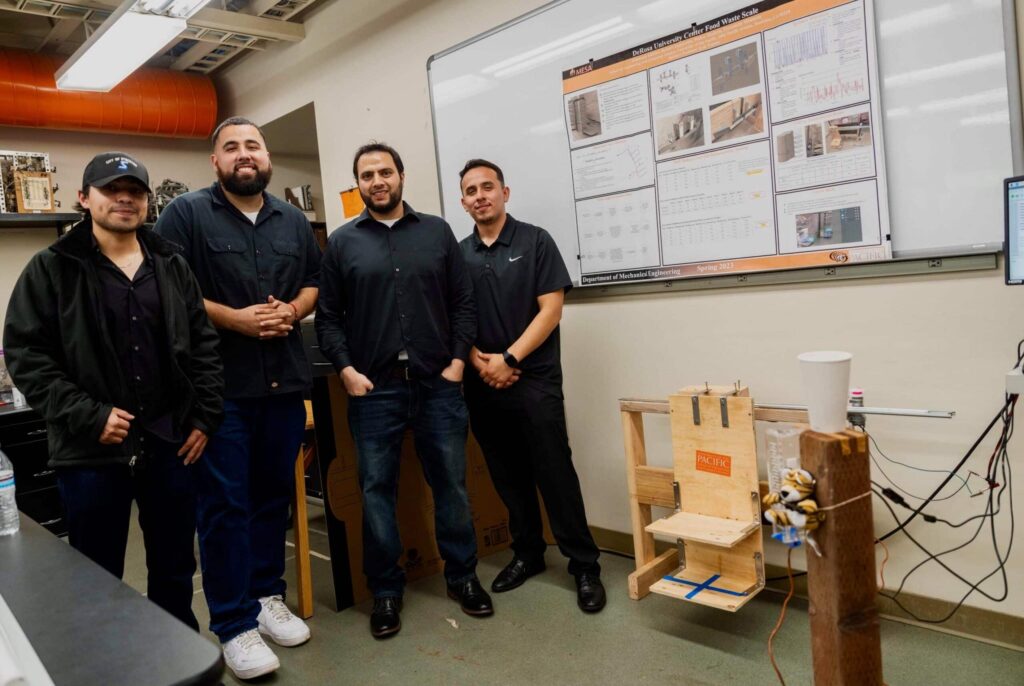
Several decades ago, the University of California system created the MESA (Mathematics, Engineering and Science Achievement) initiative to foster better participation in STEM careers by individuals of underrepresented populations. In 2022 they held a design competition at their Sustainability Summer Camp for High Schoolers. Our previously mentioned UOP team of seniors, Fernando Montero, Pedro Madera, Ammaad Akhtar, and Robert Izquierdo (pictured here left to right), became intrigued by the competition’s winning design: a food waste measuring system using QR codes on the bottom of cafeteria trays that would text students with food waste data. This system would measure the weight of trays returned to cafeteria kitchens and remove the weight of known objects (such as trays, plates, and silverware) to determine food waste weight.
Unlike the original design, the UOP group wanted to use machine learning and image recognition to automate the process of identifying the weight of known objects. To execute this redesign, they received support and sponsorship from MESA.
System Concept: Automating Weight Tracking on Cafeteria Tray Returns
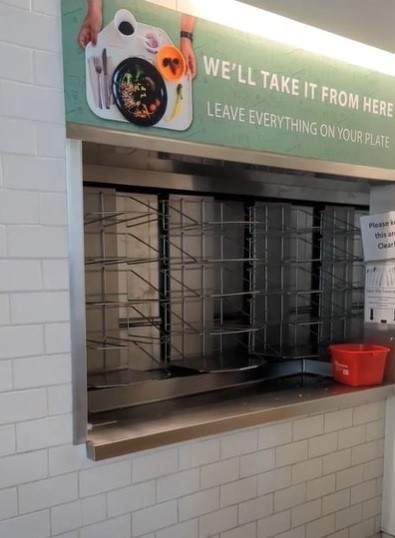
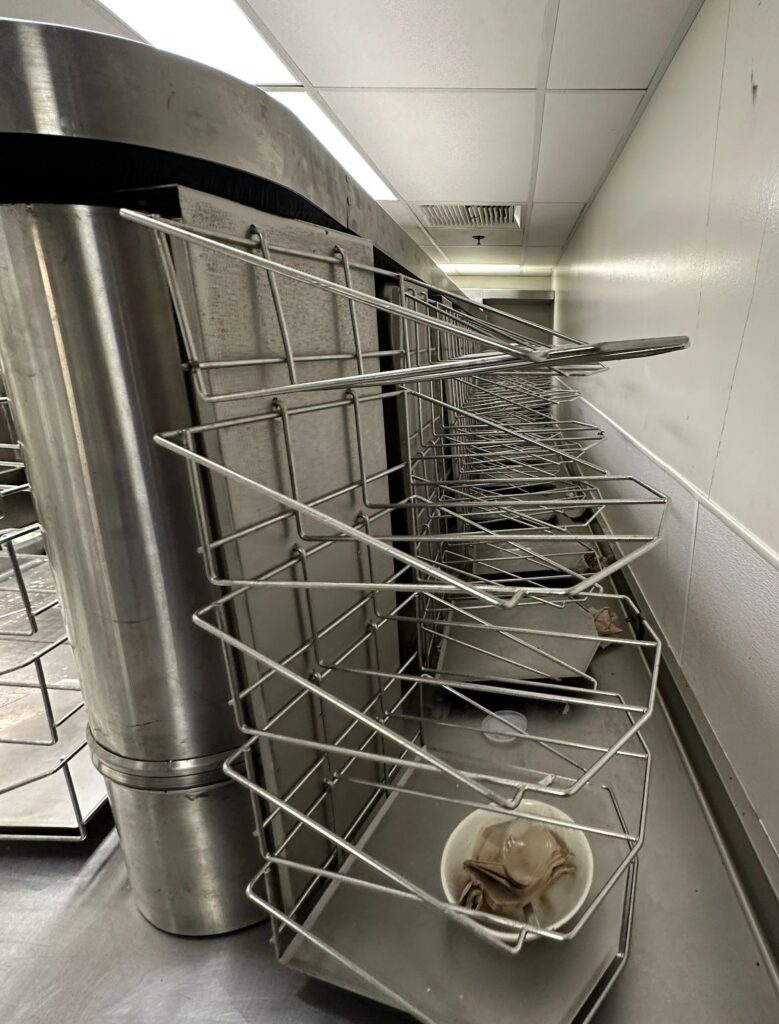
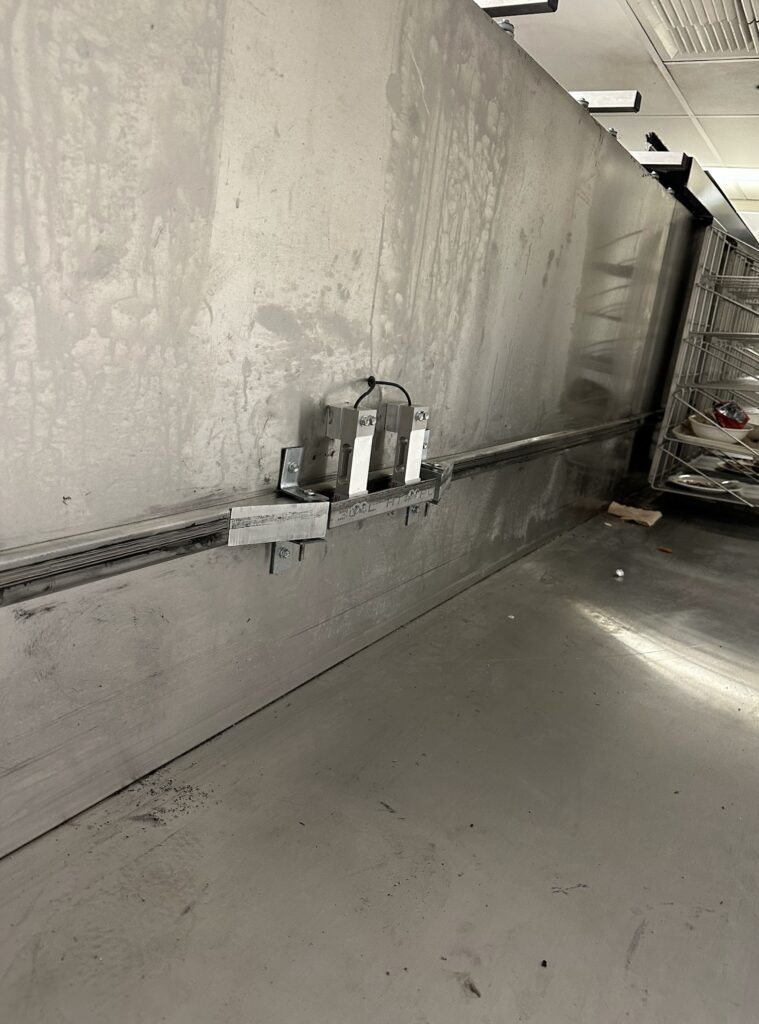
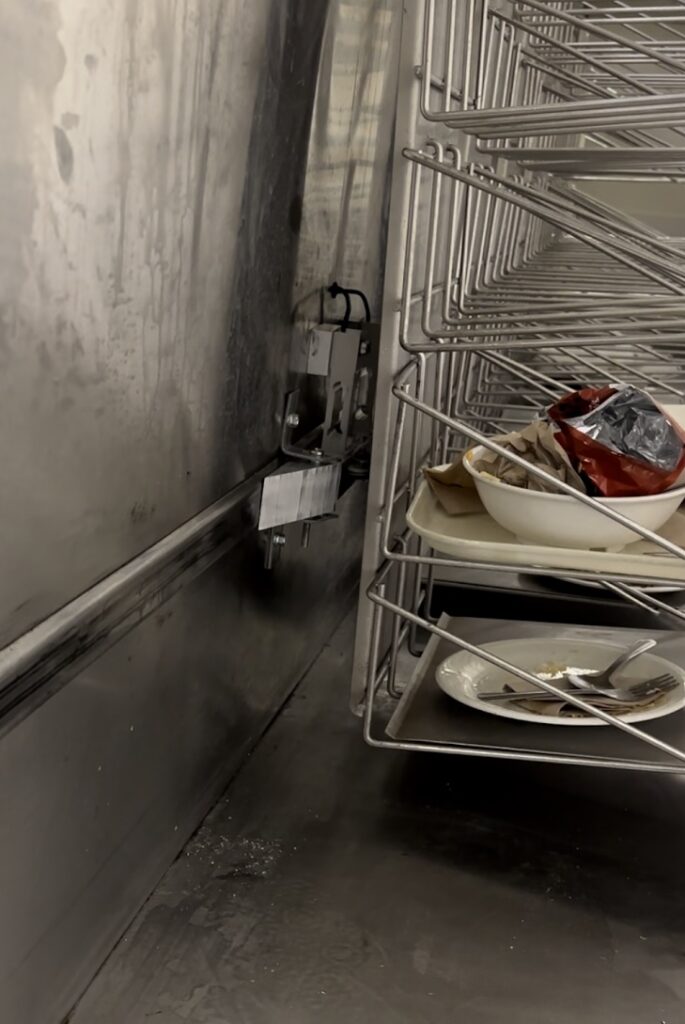
The first step for the UOP team was integrating a precision weighing layout directly into the dining hall’s existing moving tray return conveyor (Figures 1a and 1b). In this standard industrial setup, vertical tray racks hang from a motorized top chain, while a set of stabilizing rear wheels glides along a mid-wall track to keep the loaded trays from scraping or tilting on their way to the kitchen.
Mechanical Design: Single-Point Load Cell Placement on Wheel Tracks
The team chose to locate its load-measuring components along this wheel track since the pressure on these stabilizing wheels is proportional to the weight of the entire tray return racks, including all place settings, plates, glasses, and food waste. With image recognition, data processing software could remove the weight of all identified place setting items. This would leave the weight of just the food waste.
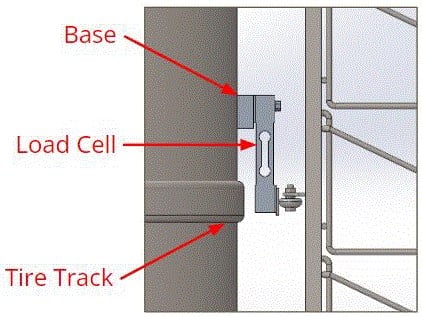
Figure 2 shows a diagram of how the single-point load cells would be mounted to the support wall. This mounting includes a base that would allow the load cells to bend under the force of the support wheels. The load point of each load cell aligns with the wheel track. To guide the support wheels onto these load points, the team designed ramps from the wheel track to a separate metal plate, which was in turn attached to both load cells at their load points. Figures 3 and 4 show the installed ramps along the wheel track.
Signal Processing: Junction Box Summing and Non-Axial Calibration
The measuring system’s physical design was just part of the challenge. The team needed to accurately collect and process the load cell’s measurements.
Because the ramps created forces that were not completely orthogonal to the wall (and therefore non-axial to the load cells), the team had to make computational adjustments to determine the tray return assembly’s actual load.
Figure 5 illustrates how the team accounted for these multi-directional forces. Because the guiding ramps cause the tray racks to pivot slightly outward from the vertical track connection point (A), the weight creates a small angular displacement ([latex]\Theta = 3.87^\circ\)). To find the true weight of the food waste (F), the team’s algorithm mapped the exact horizontal and vertical distances of the assembly’s center of gravity relative to the tracking wheels (R). By calculating this trigonometric correction, the system isolates true downward mass from non-axial structural tension.
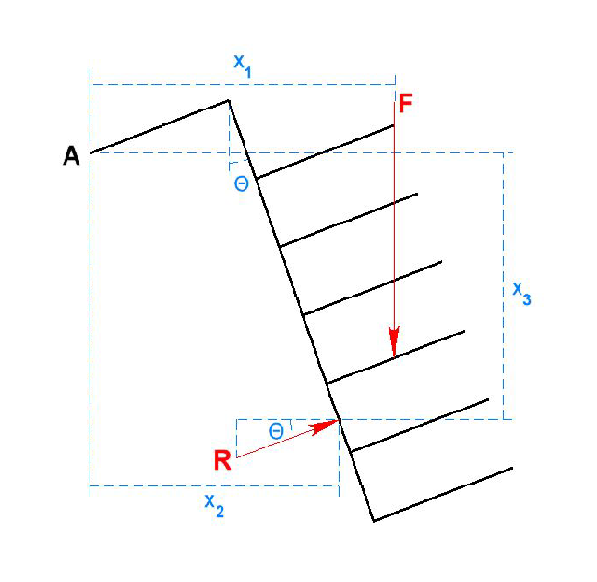
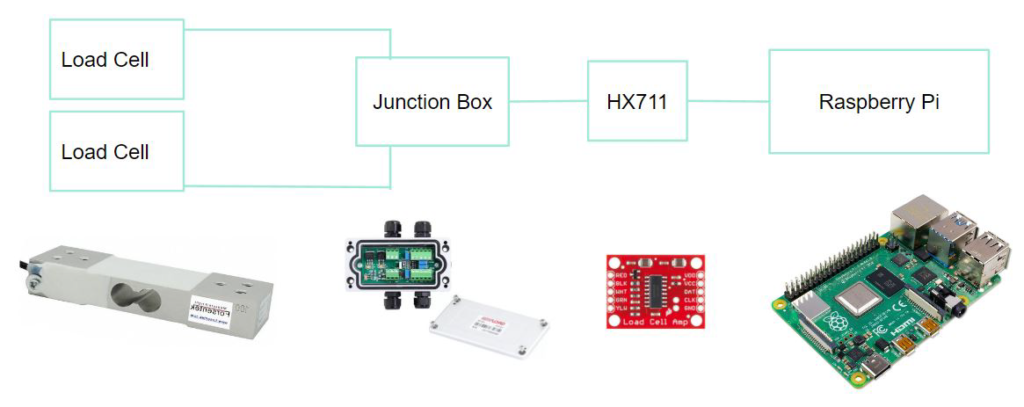
Figure 6 shows the wiring diagram for the overall concept. Two 50 kg ANYLOAD 108BA Aluminum Single Point load cells would measure the load from the support wheels. Their signals would be combined via an ANYLOAD J04EA-16 and J04SA-16 J-BOXER junction box. The junction box’s analog output would be amplified and converted to digital via a Sparkfun HX711 ADC. A Raspberry Pi 4 Model B processor equipped with a camera module would then process the ADC output, eliminate known weights, compensate for non-normal forces, and produce the desired food waste data. The group used machine learning as part of the processor algorithm to identify objects of known weights.
Project Execution: Prototyping and Live Integration
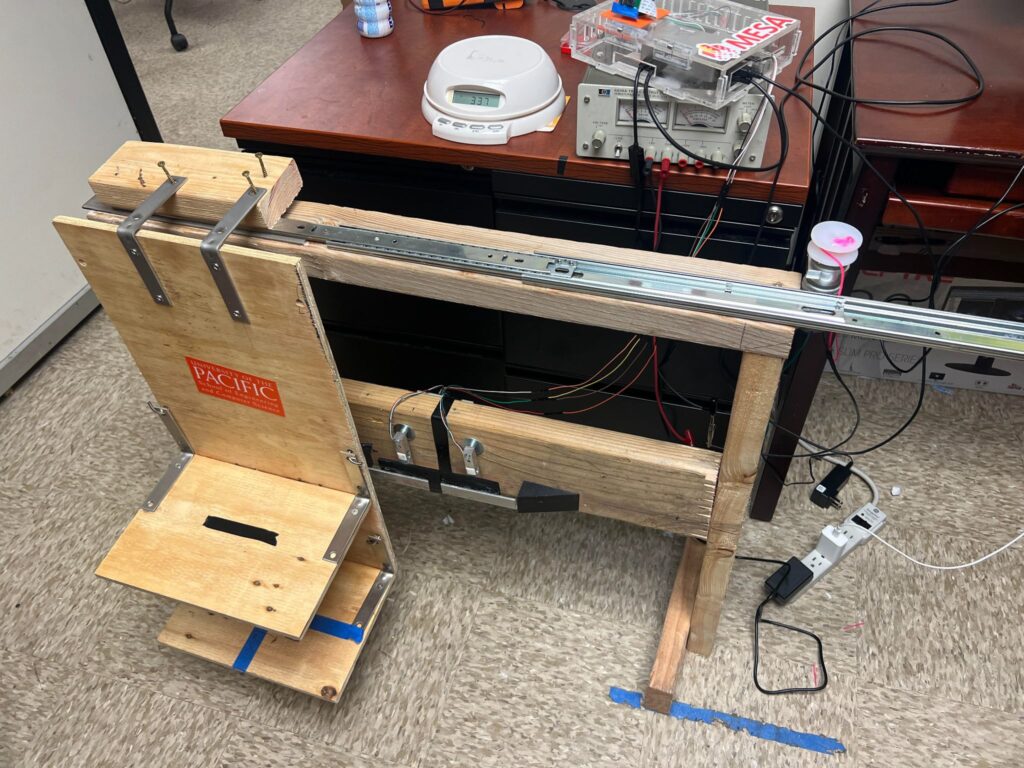
Before building their concept into the cafeteria rotating rack system, the team created a test system. This test system would verify the physical design would produce appropriate aggregate weight data. Figure 7 shows the team’s mock-up.
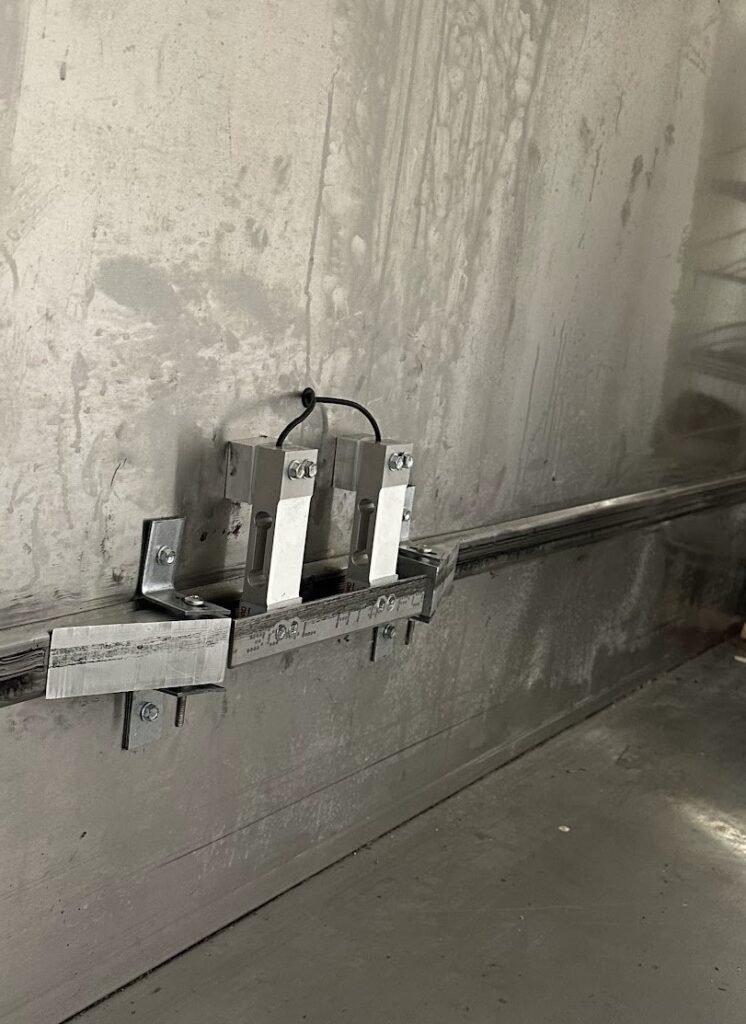
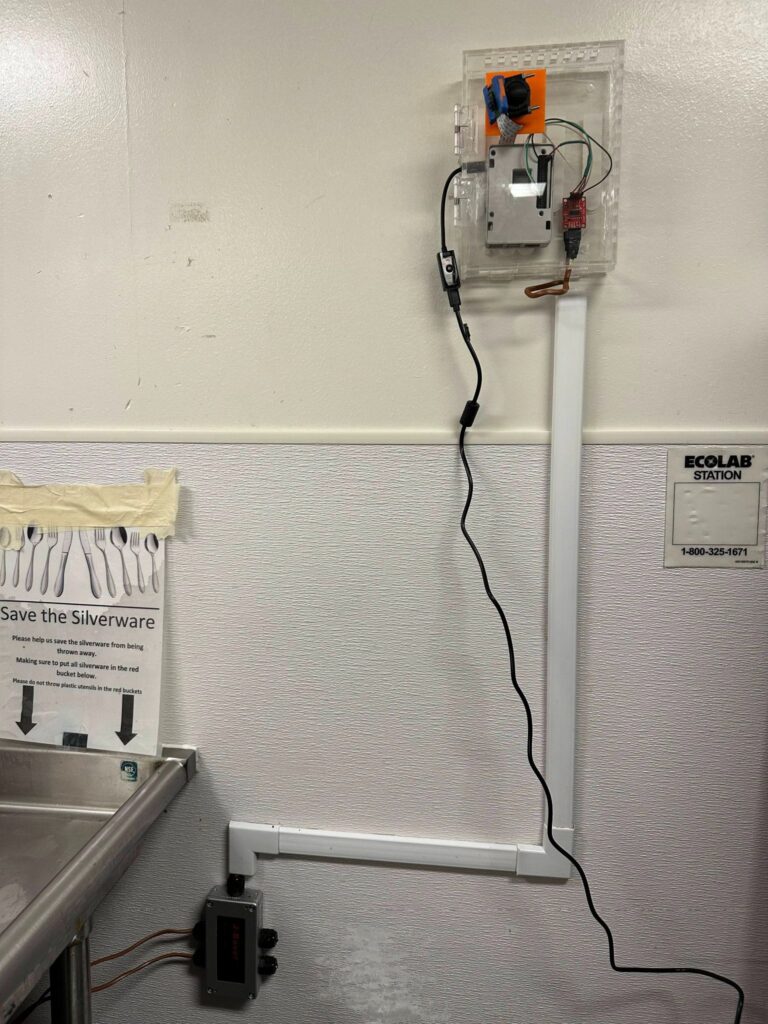
Once testing proved the design’s viability, the team built their live version within the dining hall’s tray return system! Figures 8 and 9 show the front-end track assembly and back-end electronics respectively.
The Project’s Future
The system is now live and collecting data. However, this team of seniors graduated (happily!) before they could fully complete the machine learning portion of the design. Fortunately, a new crop of students within the MESA program will be taking over the project from here.
The goal is to complete the machine learning algorithm and decide how the resulting food waste data will reach students. Several ideas are being considered. These include displaying data hourly on a cafeteria monitor or sending daily data to students via email. Because its ultimate goal is to promote social responsibility, the project would need to reach the widest possible audience. Email would have a broader reach; however, other methods may attract more attention.
In Closing…
Tacuna Systems is proud to have once again been able to be part of a university project. We are especially pleased to support one like this that has the opportunity to positively affect our environment. We wish the MESA participants well and look forward to seeing is project’s completion!